Many accounting pros have told us that it can be challenging to communicate with clients about the overall financial status of their business. It’s incredibly time consuming to boil down hundreds of rows of data into a report that is easy to understand, and more importantly, act upon. We know this often means sifting through information and manipulating data in a spreadsheet to present key insights about the business. And, only then, if you have time, can you guide your client toward decisions that will impact their overall success.
Only half of small businesses survive their first five years, but with you by their sides, their odds of success double. Your input can be transformative. QuickBooks® is investing in ways to help you have an even stronger influence on business outcomes, which is why we are excited to include introduce the Business Performance Dashboard, with the addition of industry benchmarks as part of your QuickBooks® Online Accountant ProAdvisor® benefits.
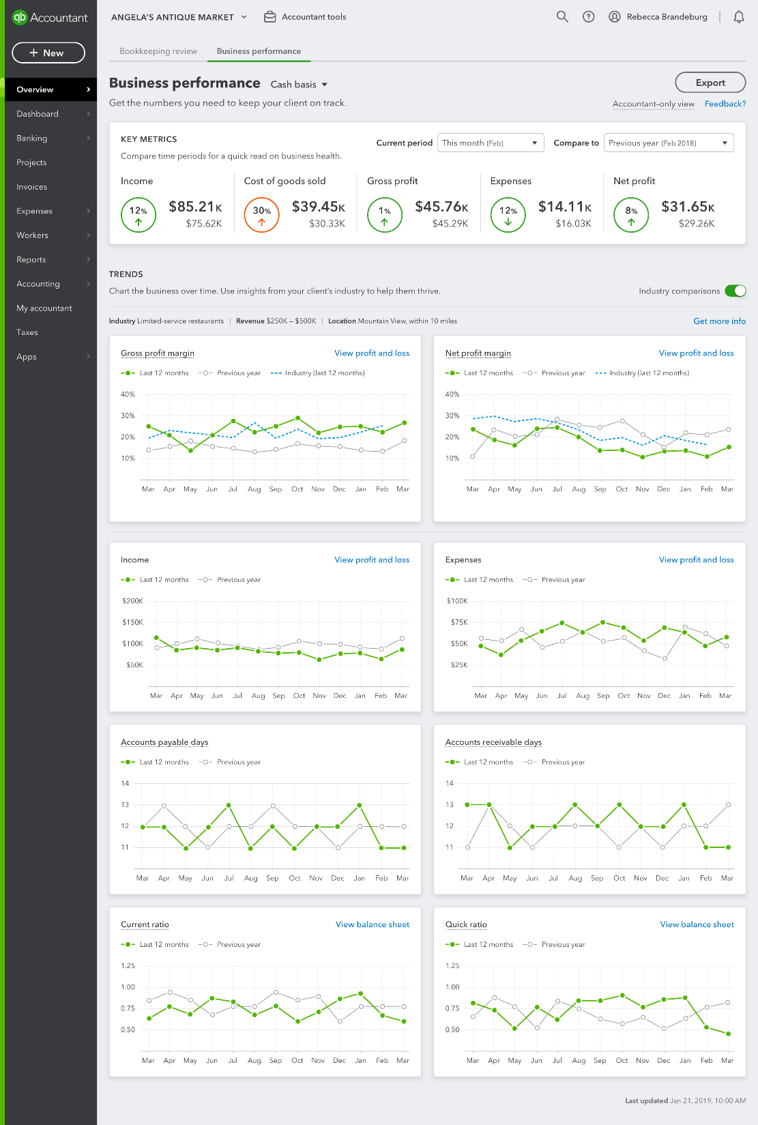
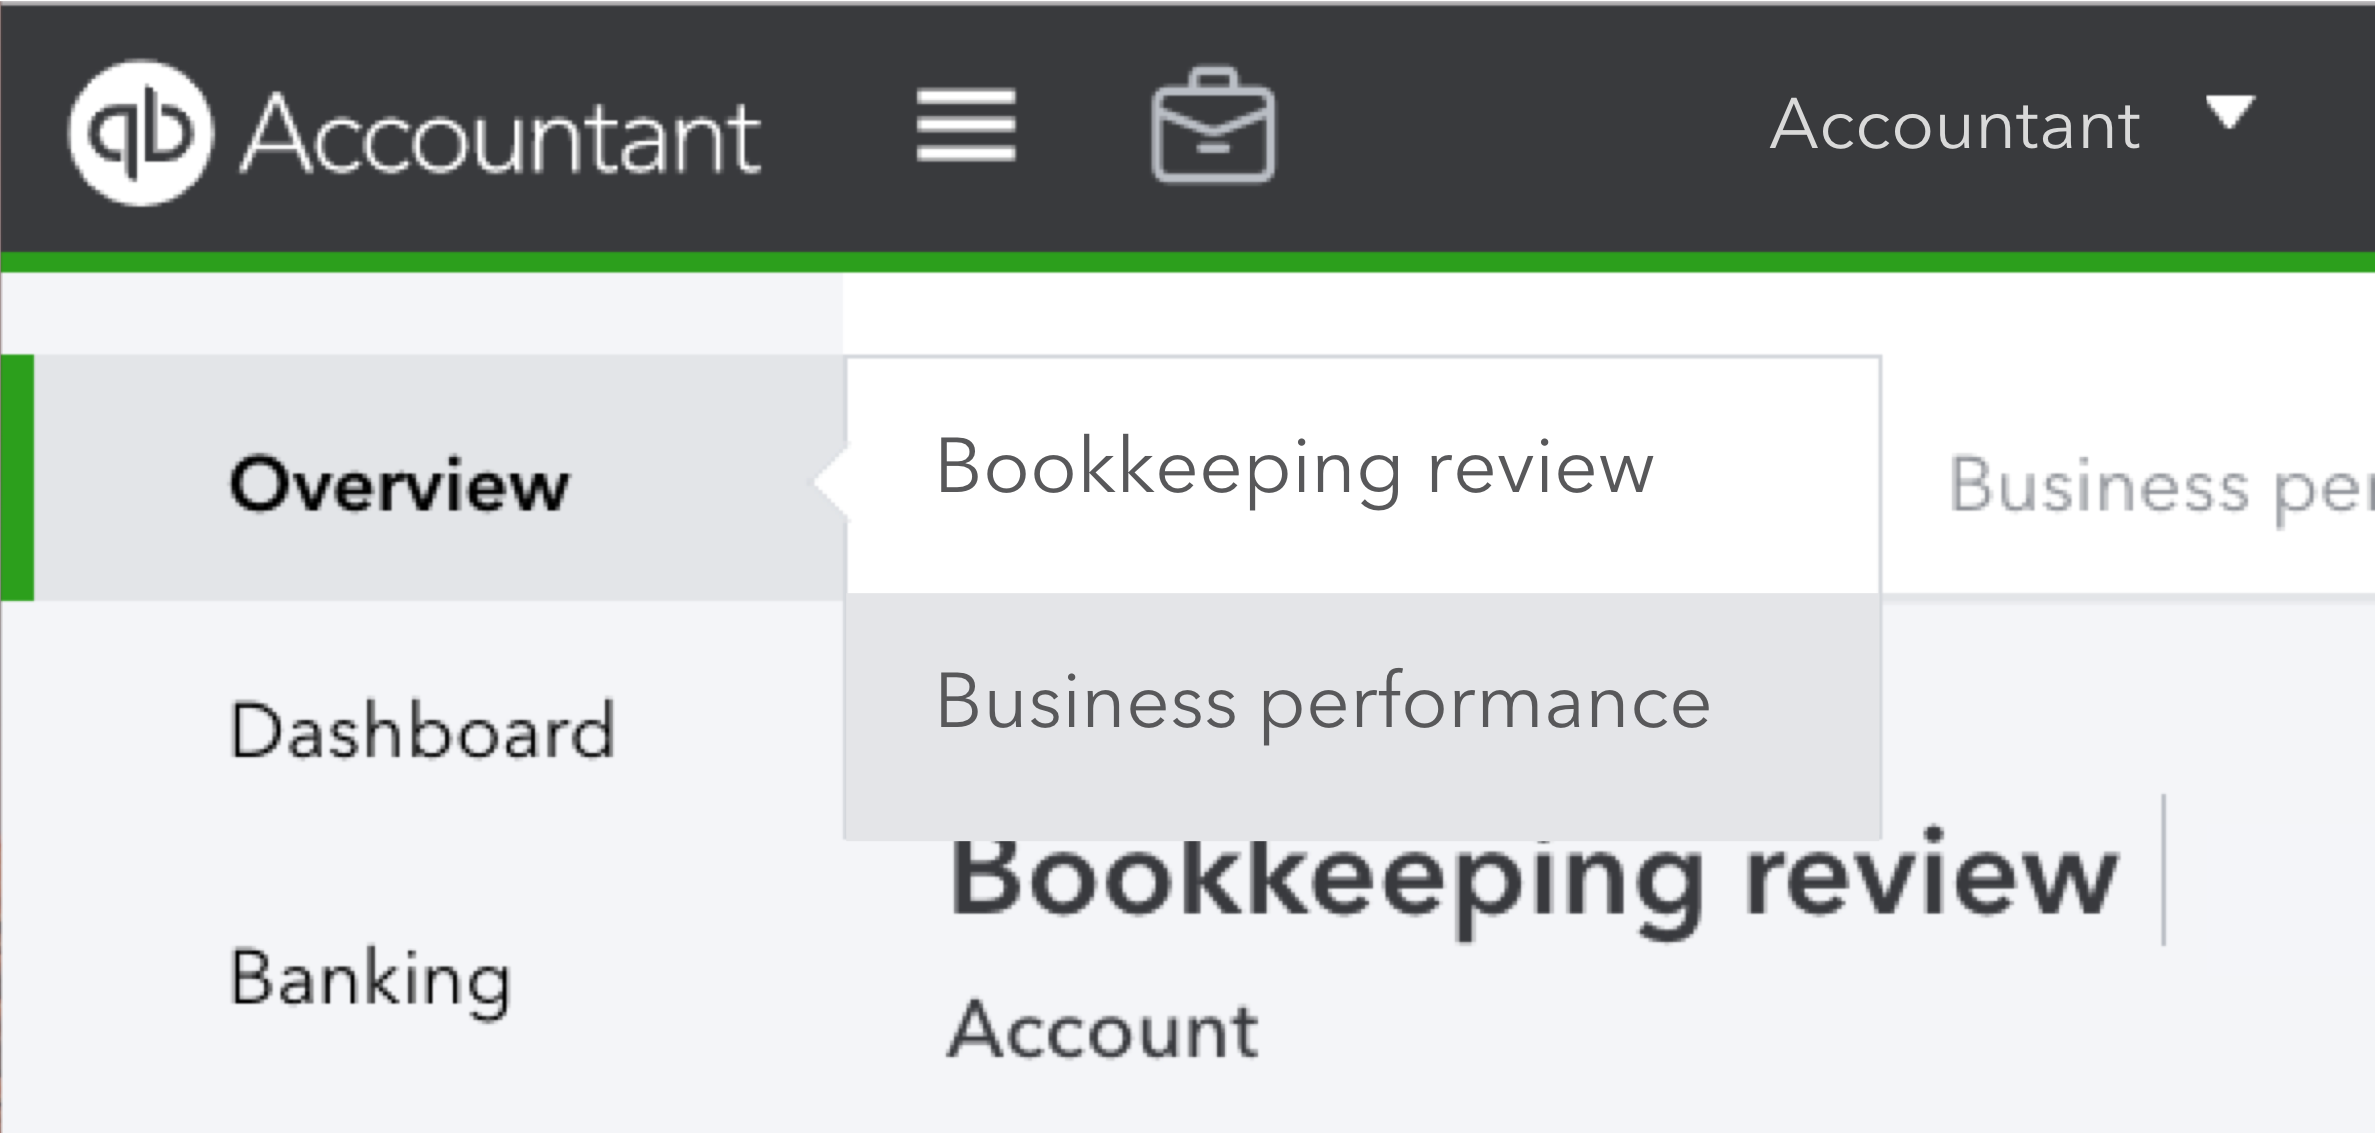
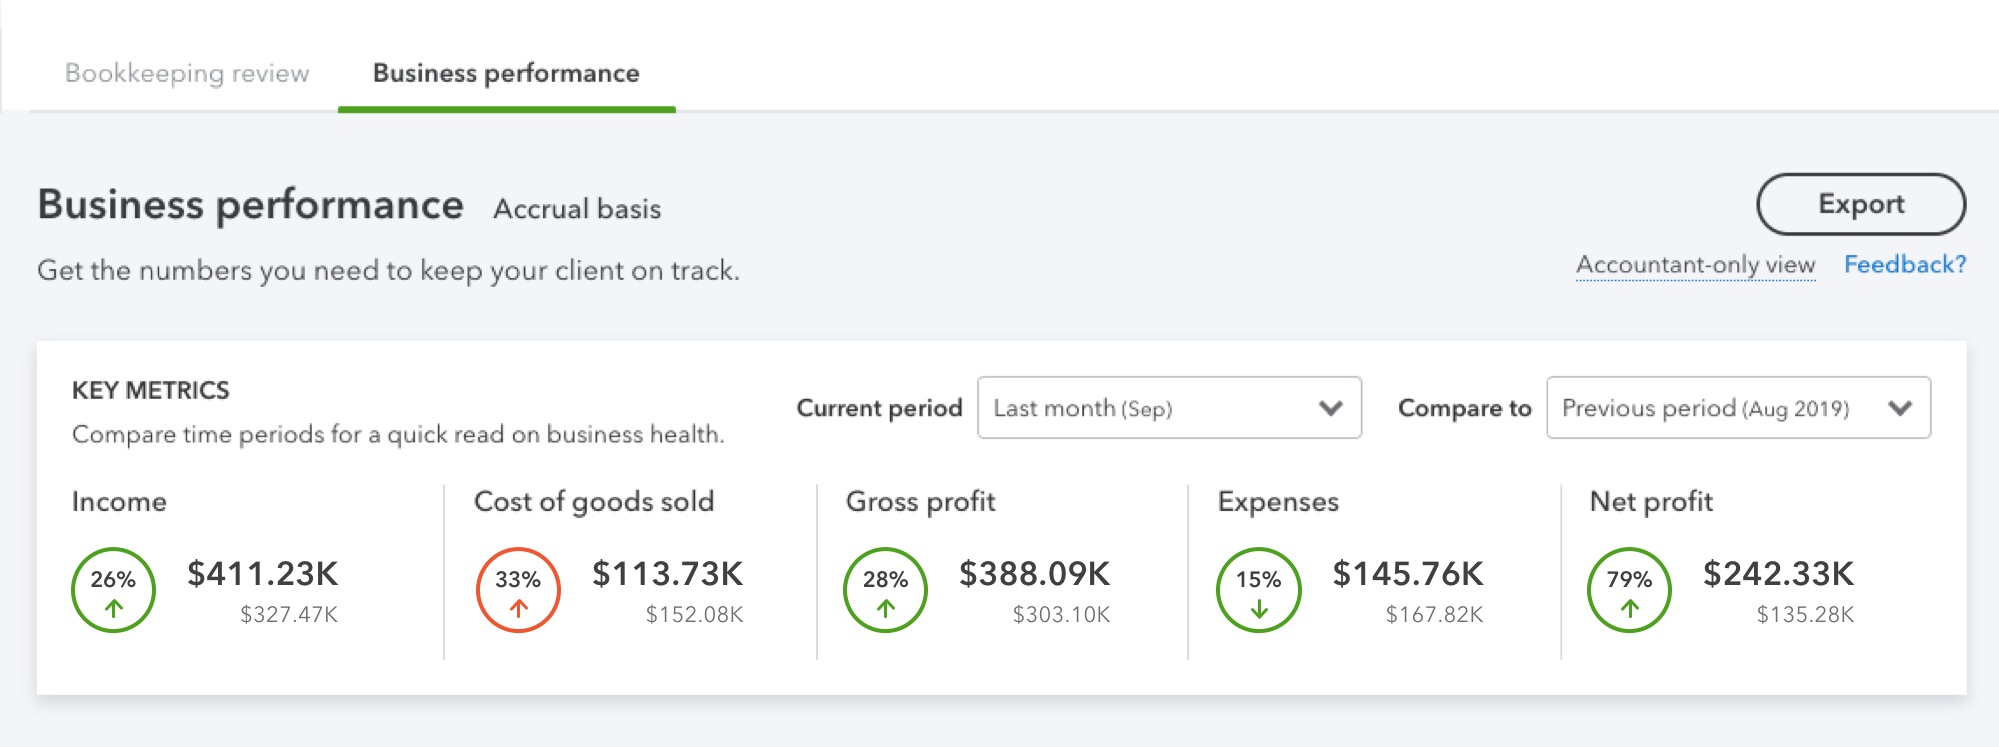
Business performance is only available through QuickBooks Online Accountant to spark conversation and strategic recommendations between you and your clients. It analyzes your client’s data and pulls out just what you need — key figures, useful indicators, actionable items, and more — organizing it into one, simple, visually-driven dashboard.
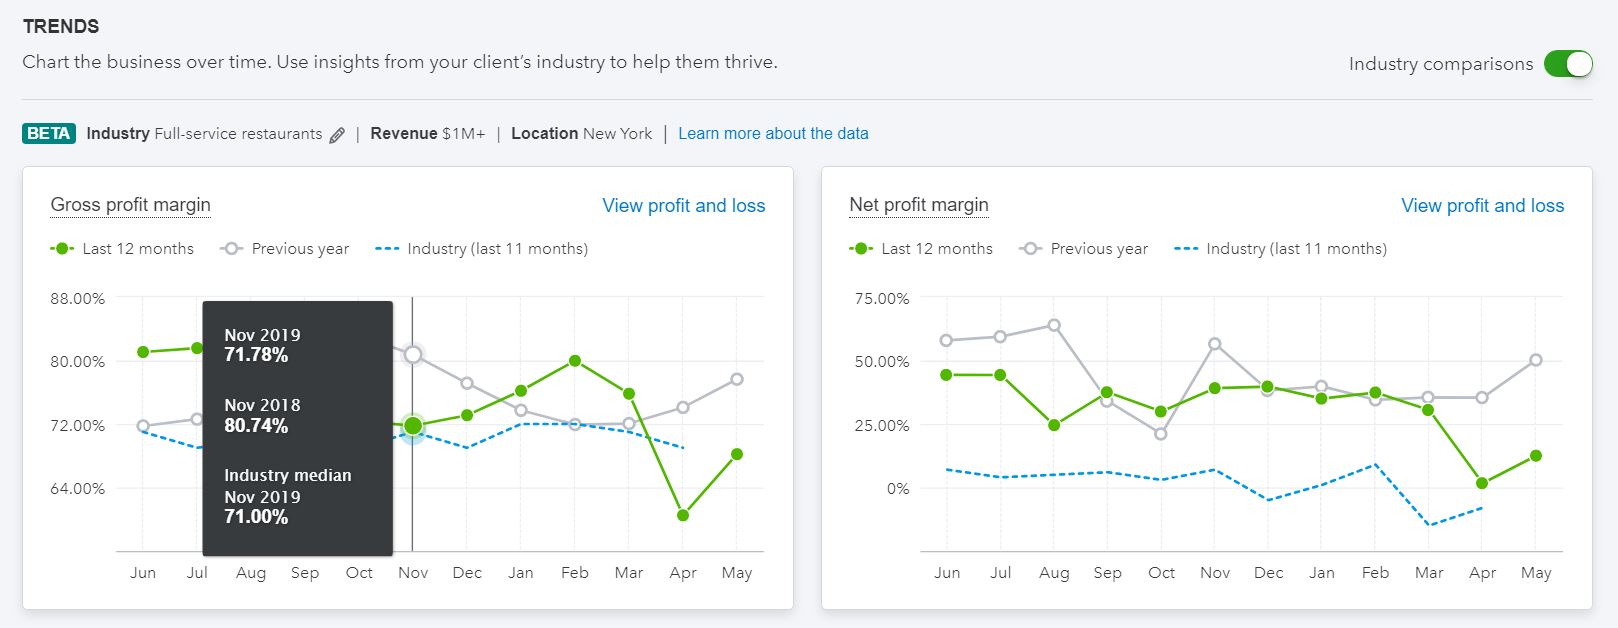
With the addition of industry benchmarks, you can now bring expert-level industry insights to client advisory, enabling you to better identify areas for business improvement and set smarter goals. Using the power of aggregated, anonymized QuickBooks data, you can compare your clients’ business performance to similar businesses in their industry, in the same location and with similar revenue. What’s more, you can easily export the report to share with a client.


