Accountants discussing new features in QuickBooks Online reports with their client.
product update

New features in QuickBooks Online reports bring better customization and navigation

Clients have many different needs and nuances when it comes to reporting, whether it’s creating comparisons between various periods or changing the names of account groupings and ordering columns. Accountants often export various reports from QuickBooks® Online and piece them together in Microsoft Excel to achieve the level of customization needed.

Recent improvements to the functionality and navigation in the report center will not only save accountants time, but also further help them streamline their client reporting processes!

With so many improvements added to the reporting functionality in QuickBooks Online, let’s take a deeper look at each one to see just how reporting has been made more efficient and customizable to meet the needs of all types of businesses and accounting professionals. In this article, discover how these great new features and functionality will make your life a bit easier when working with reports in QuickBooks.

Improved performance and navigation

Several enhancements have been made to the performance and navigation of reports in QuickBooks Online. We’ll take a look at each one to see just how these improvements make reporting in QuickBooks easier and intuitive.

Enhanced data limits

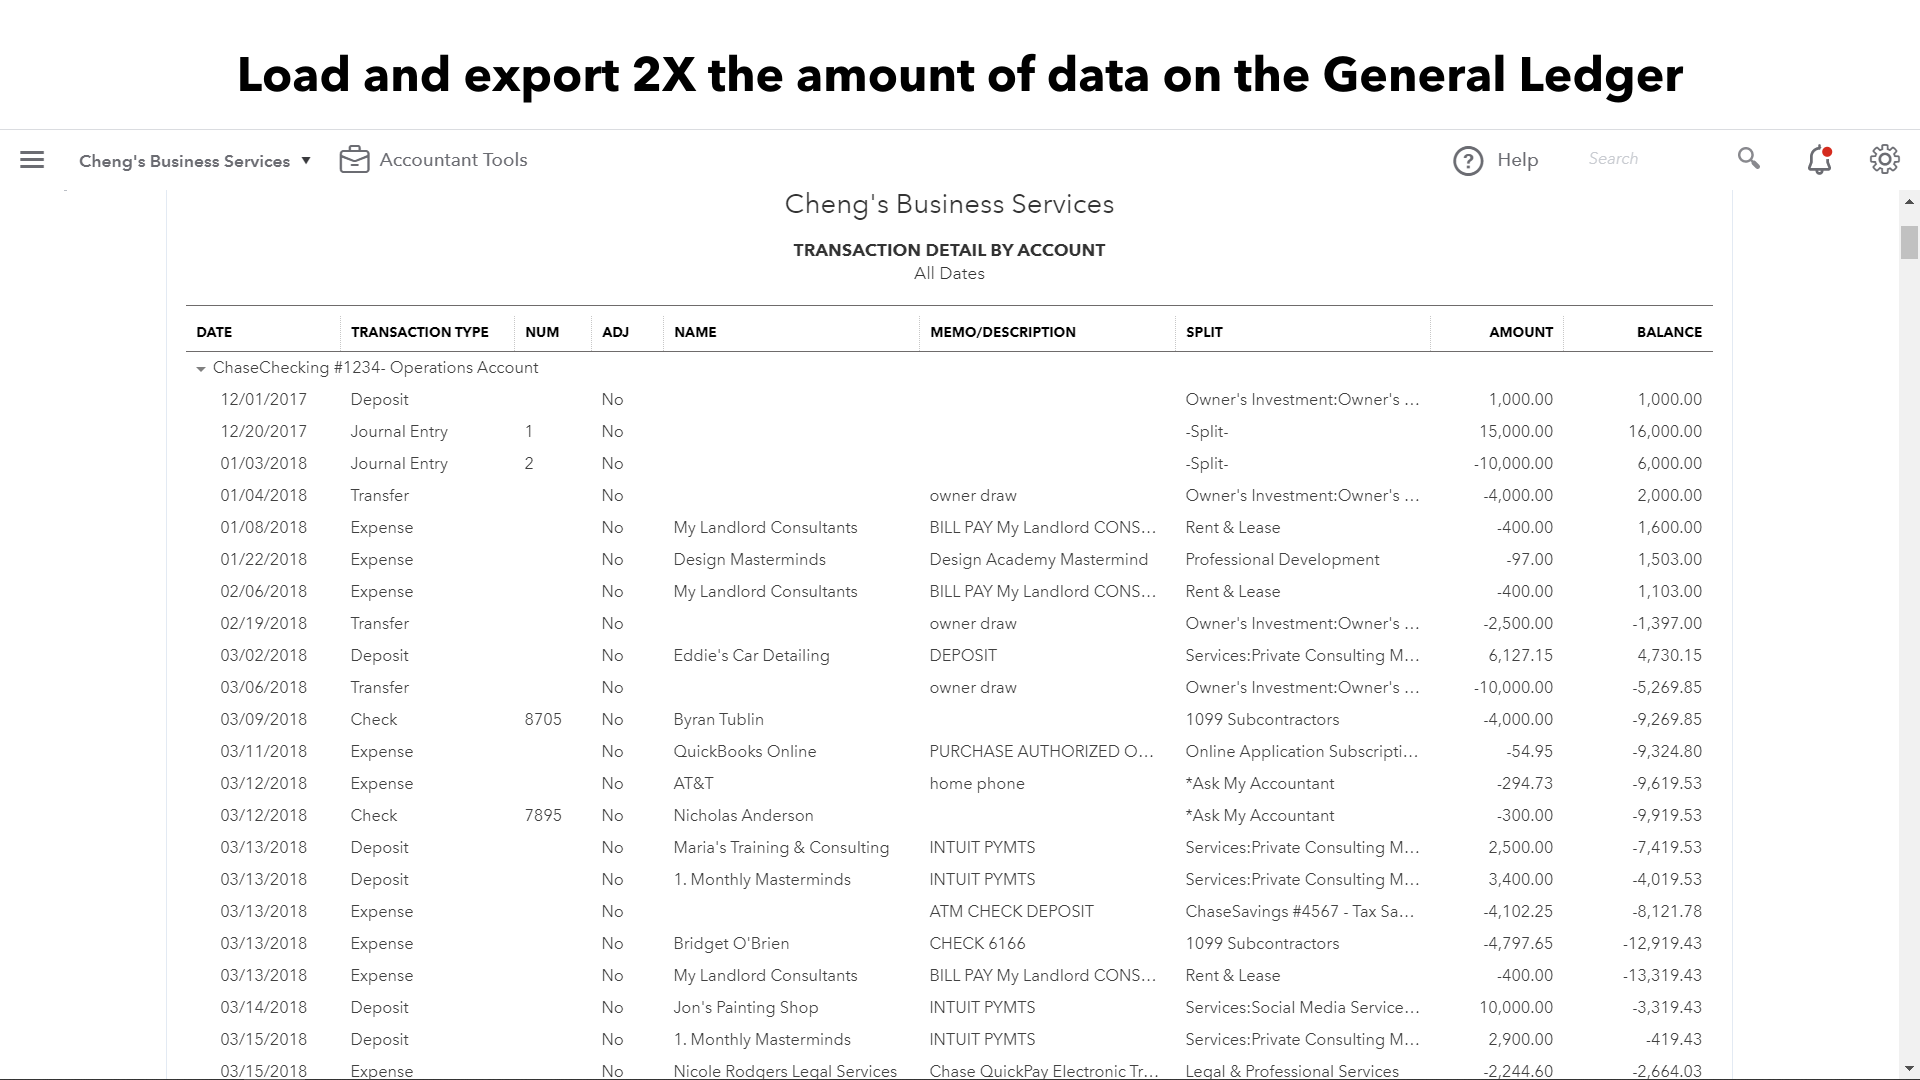
To start, twice as much data now loads onto the screen when you run the General Ledger report in QuickBooks. This means you no longer need to click “load more” to view all the general ledger data for a period.

Enhanced “find” feature

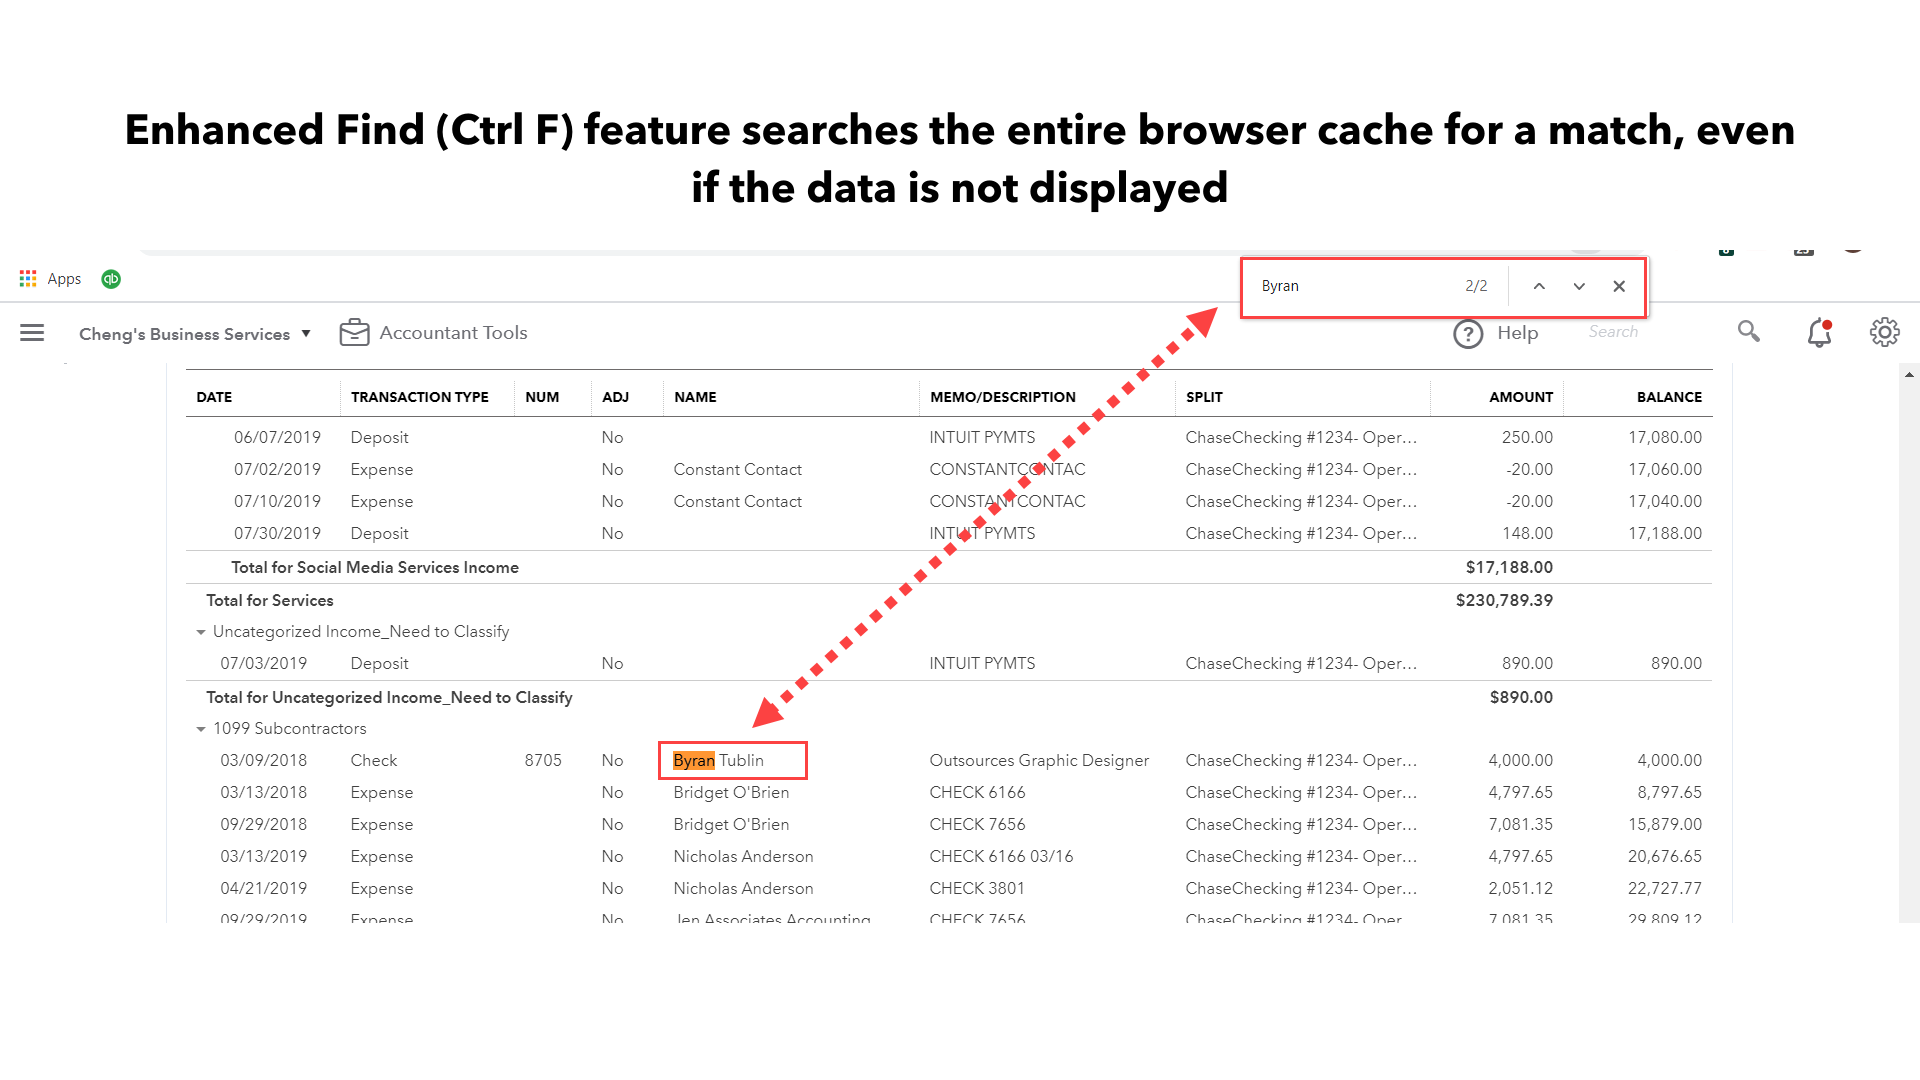
Users with a large QuickBooks Online database will also benefit from the enhanced CTRL–F feature. Intuit® customized this function so that it will search the entire browser cache for data, even if it’s not displayed on the screen.

Select the next arrows in the “find” window to quickly jump to the row with the search results.

These enhancements resolve data load issues for more than 70 percent of companies with a large QuickBooks database.

Smooth scrolling

Scrolling though large reports is intuitive and easy to use. Users will notice how the scroll bar moves smoothly through the report data and pages, while allowing you to stop and resume without the cursor jumping back up to the top of the page.

Smart QuickZoom

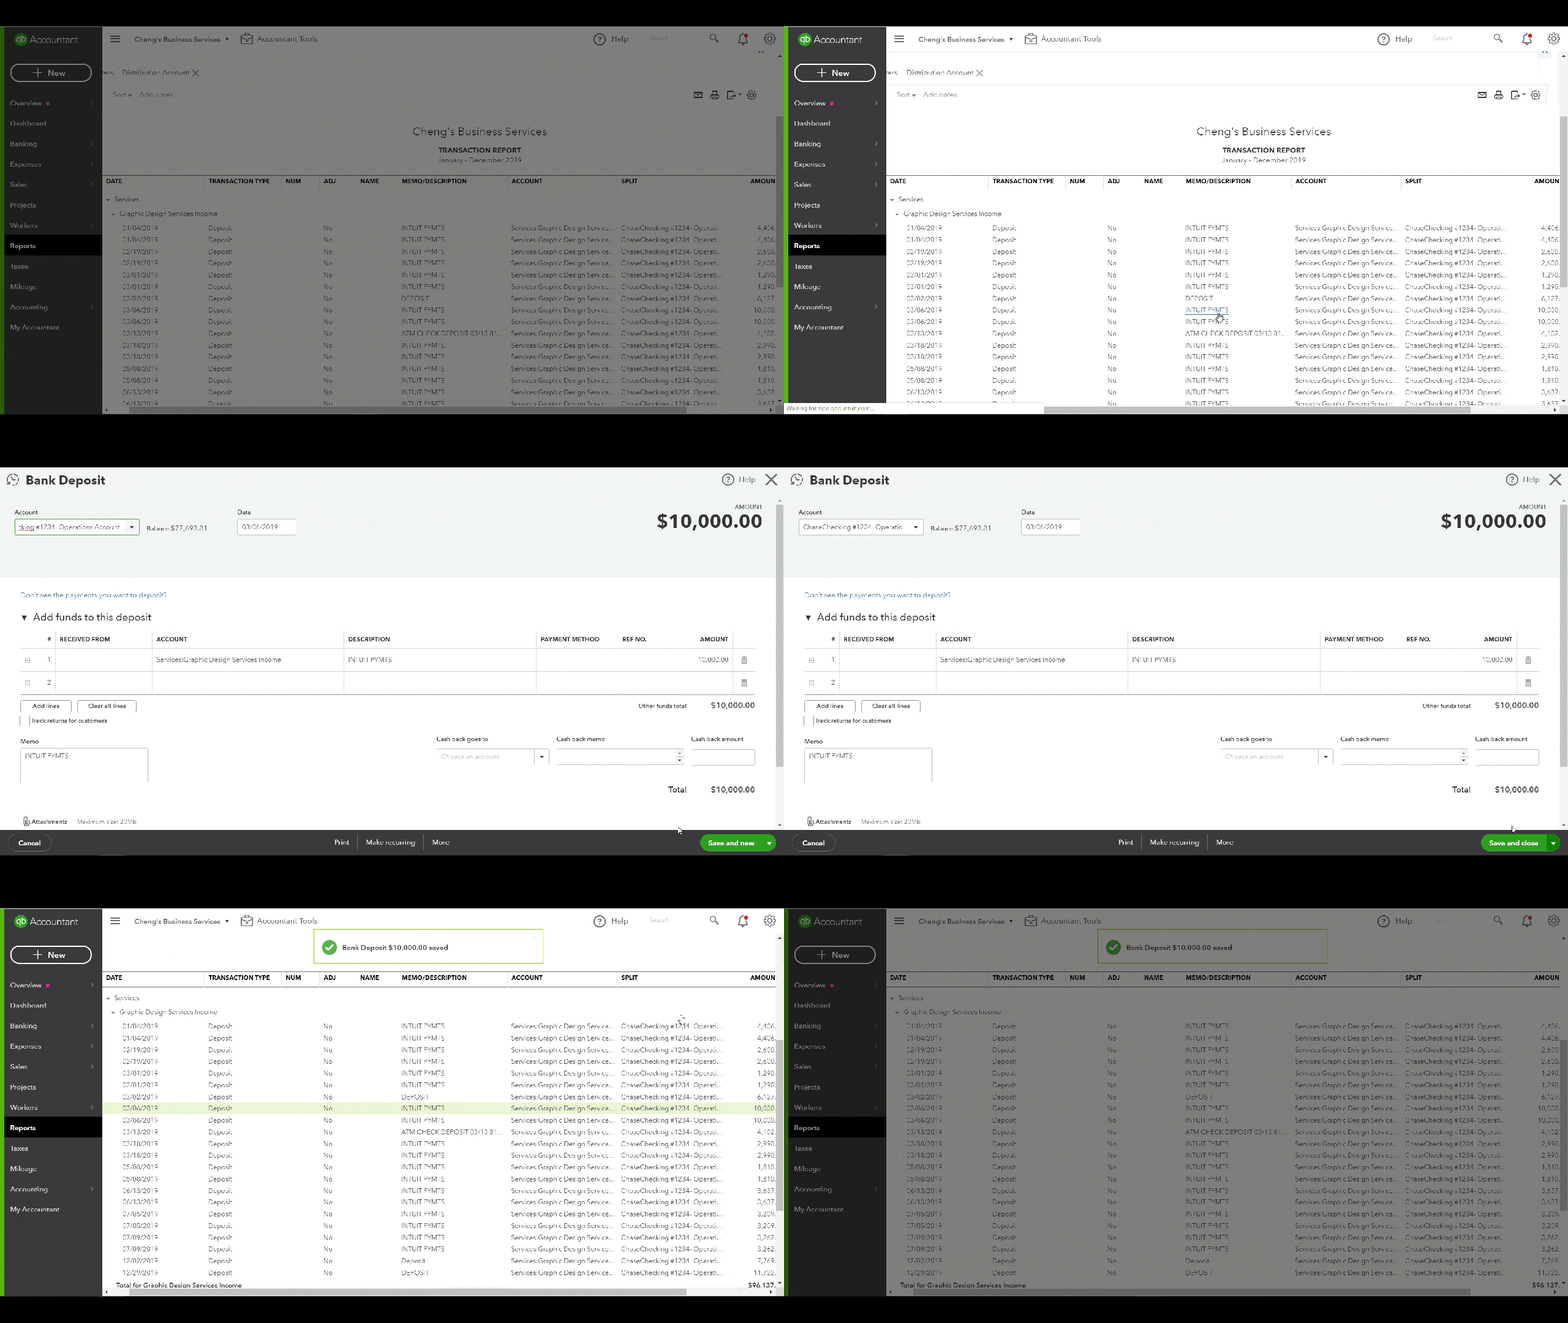
QuickZoom allows users to drill down to see the detail of an amount on a report. By selecting an amount from any row in a summary report, such as a Profit and Loss, a detail report will open that displays a list of the transactions that make up that amount. Then, select a row from the detail report, and the transaction screen for that specific transaction will be displayed. When you close the transaction screen, or select < Back to report summaryQuickBooks remembers which row was selected and returns you to that area of the report, rather than the top of the summary report page. Click the gif below to see how it works!

Additional customization options

Clients who use QuickBooks come in all shapes and sizes, from solopreneurs to large non-profit agencies with hundreds of employees. Each company, no matter what the size, has unique reporting needs and requires some level of customization. The report center in QuickBooks Online provides customization options to help business users glean the information they need to run their business, and that accountants need to provide guidance and fulfill compliance demands.

There have always been lots of options available to customize reports in QuickBooks, including the ability to quickly toggle between cash and accrual accounting methods, collapse and expand accounts and sub-accounts, group by various report fields, and add columns to compare and analyze report data. New features that have been added to report customization now allow you to edit section titles, and include expanded period comparison options.

An improvement rolling out in phases to all QuickBooks Online companies soon will allows users to edit and change the section titles on reports

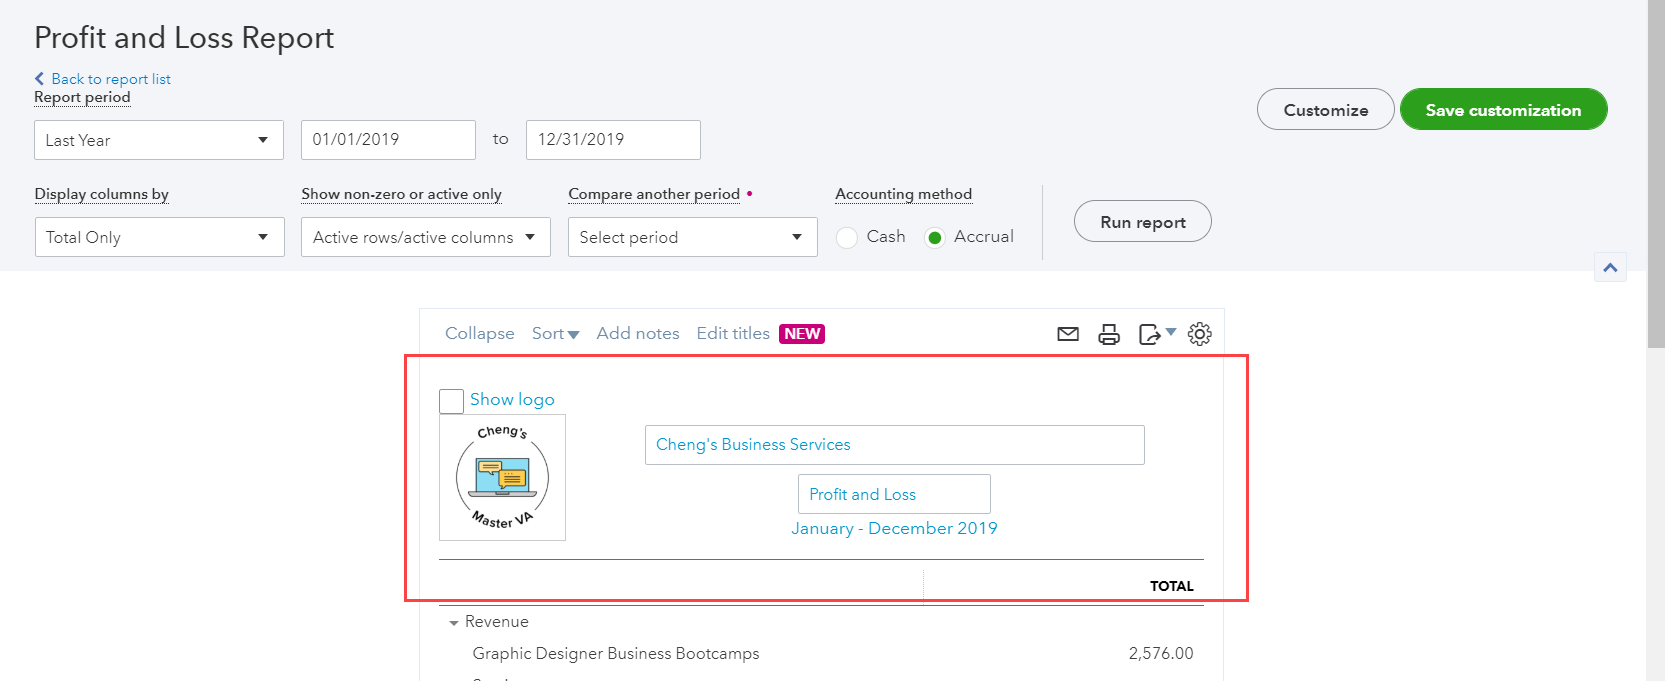
QuickBooks users have always had the ability to change the title and other header information on reports by clicking on the pencil icon in the header section of a report to open and edit the company name and report title – or even display the company logo.

A recent improvement now allows users to edit and change the section titles on reports

This feature saves users time and effort by eliminating the need to export a report to Excel in order to change the section titles. Section titles can be changed for the Profit and Loss and Balance Sheet reports, and are applied to all variations of each.

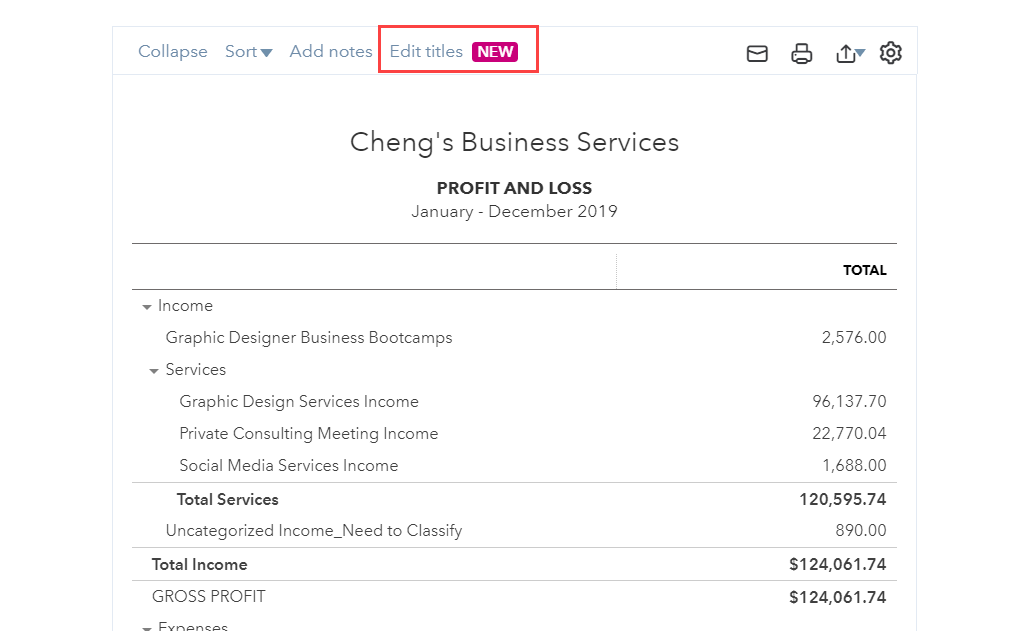
To change the section titles of a report, select “edit titles” from the customize ribbon at the top of a Profit and Loss or Balance Sheet report.

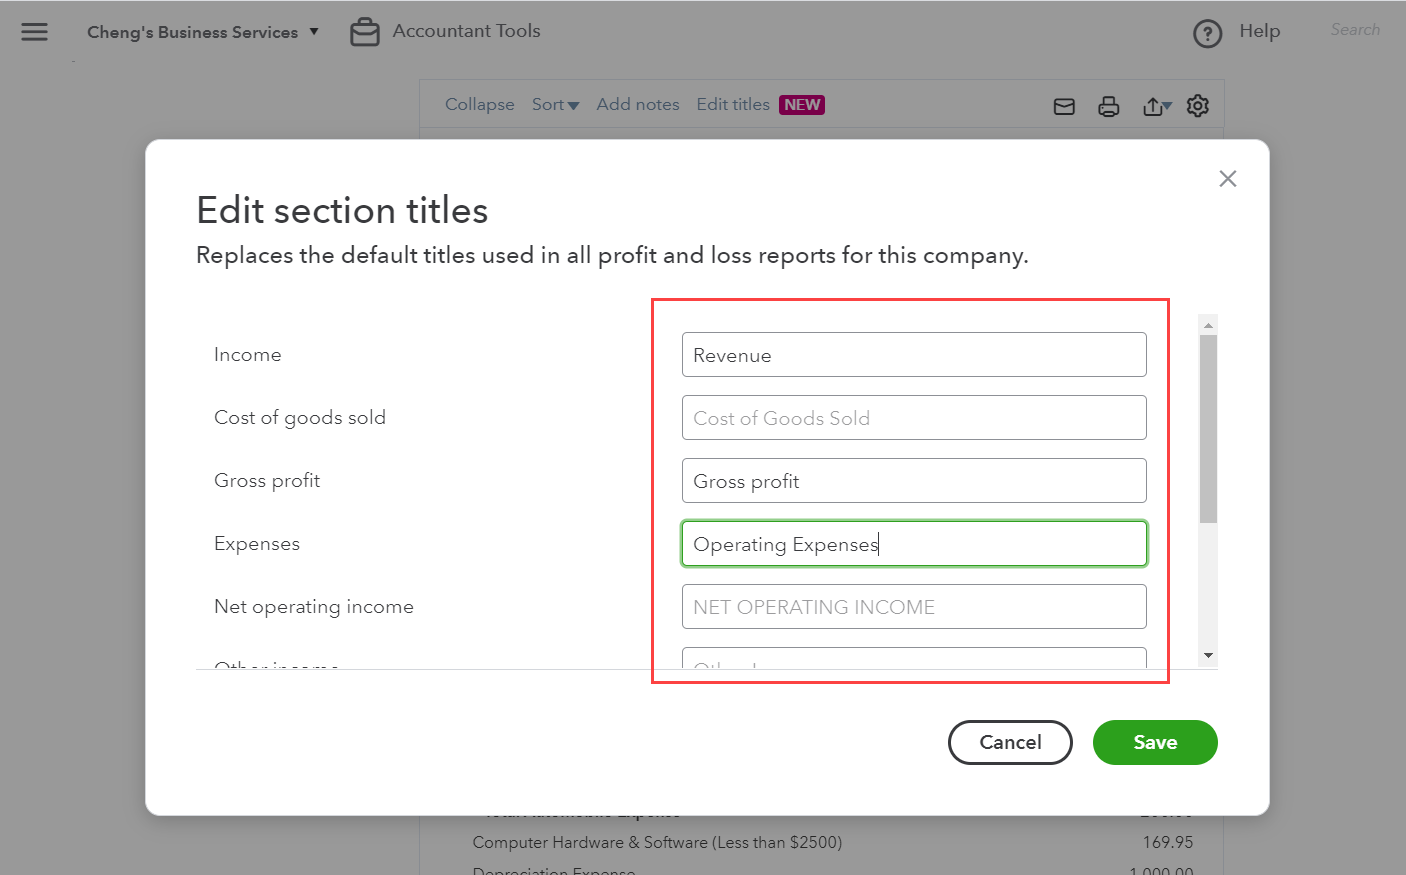
This will open the edit section titles screen, where you can change the titles of the report. Section titles that can be changed on the Profit and Loss report include:

Type your changes into the boxes and select save.


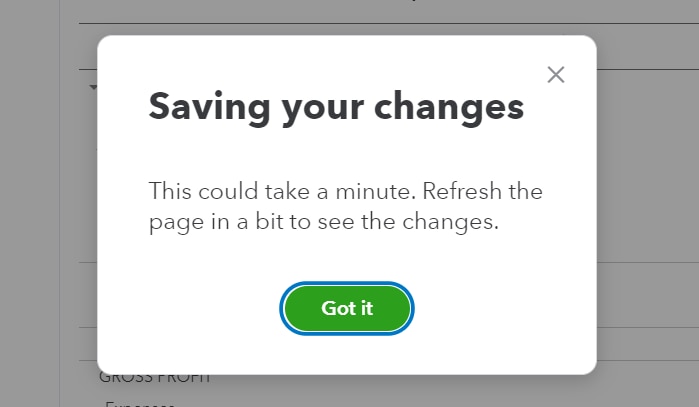
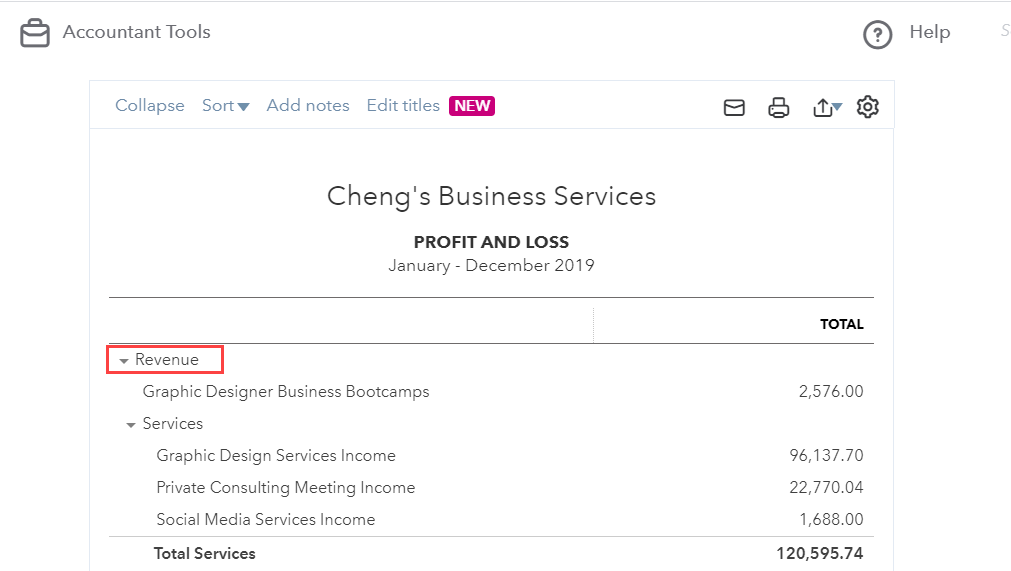
The changes may take a minute or two to update. Select got it, refresh your browser, and the new section titles will appear on your report.

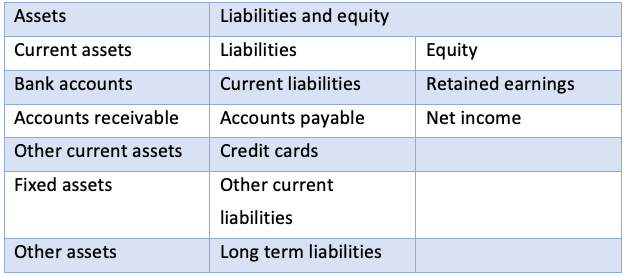
Section titles that can be changed for Balance Sheet reports include:

Note: Section titles will be applied to all Profit and Loss or all Balance Sheet reports, including comparison and detail reports.

Improved comparison options

One of the major benefits of using QuickBooks Online is the flexibility to compare different elements in the database to find and analyze trends. Another way to do this is by modifying columns and the way they are displayed on reports.

Reorder comparison columns on summary reports

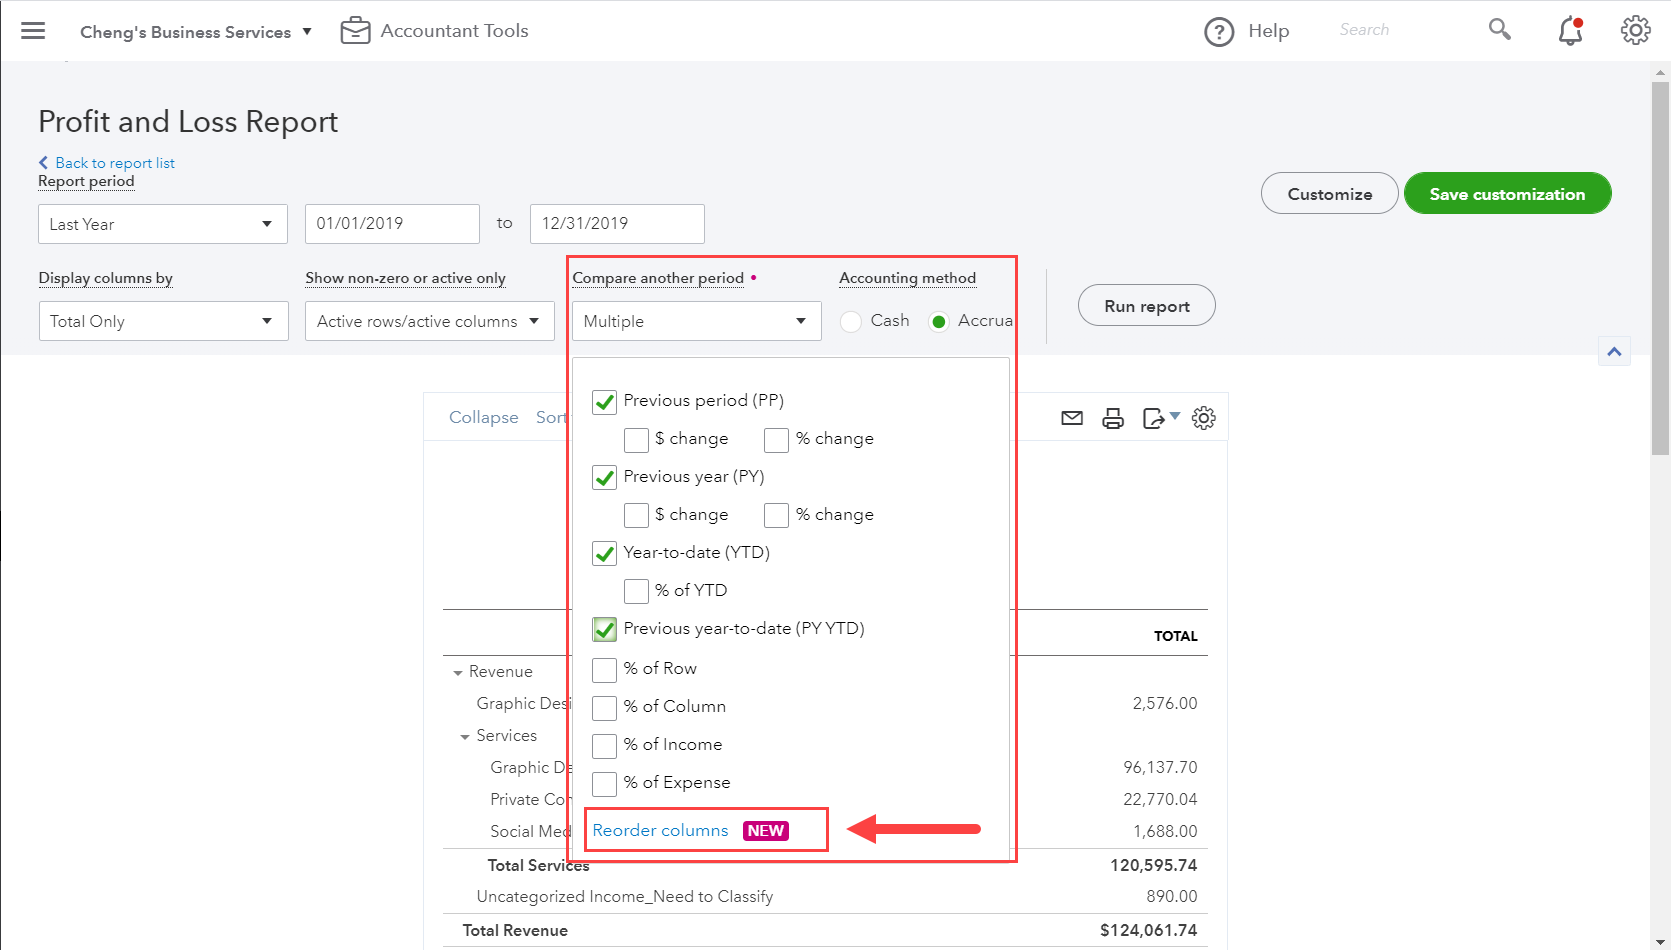
You can create reports that compare a period to year-to-date (YTD), previous period (PP), previous year (PY) amounts, and previous year-to-date (PY YTD) on a single report, and reorder the columns as you prefer. In the past, this was done by exporting multiple reports to Excel and piecing them together manually. As you may have guessed, previous year-to-date is a new option when running Profit and Loss Summary reports – added to QuickBooks Online based on feedback by users like you!

Custom prior periods

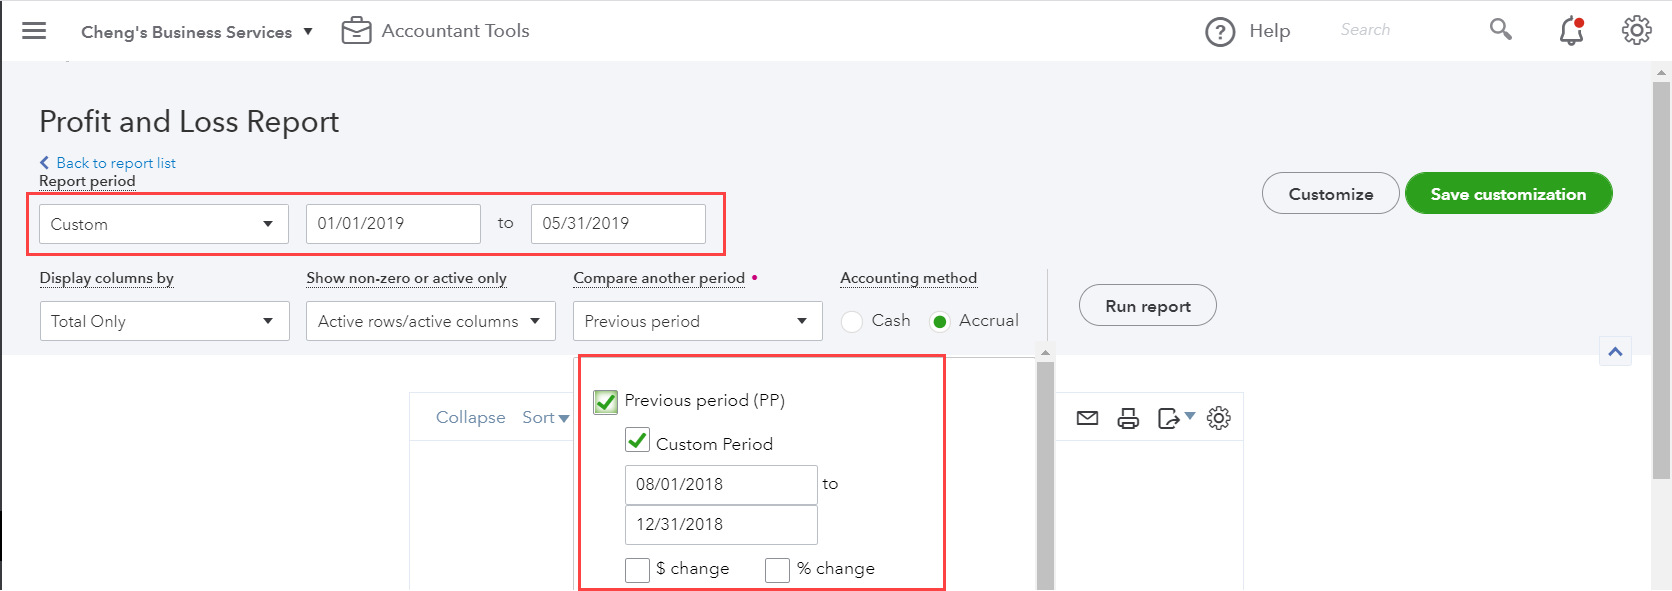
Another fantastic improvement is in the way custom prior periods are displayed on reports. They now automatically calculate full month date range, and you can select a custom prior period to compare to when you select a custom report period for a report.

In the past, prior period comparisons to custom report periods used the number of days included in the custom date range. This often meant that previous period comparisons would leave off a day, and users would have to manually prepare this report view by exporting multiple reports to Excel. With the recent improvements, if the custom date range selected is for a full month, such as Feb. 1 through Feb. 28, the previous period comparison will automatically select beginning to end of month for comparisons, versus 28 days. This is a fantastic improvement, saving users tons of time and effort spent exporting and modifying reports in Excel!

Collapse/expand row options saved with custom reports

Many companies prefer to track detailed financial information by using lots of sub-accounts. This allows management and other users to gain visibility into income and expense detail in a single report, without the need to drill down into the report. This practice also makes for a very long report, and can create extra work for accountants and other users, when they want to view the report in summary format.

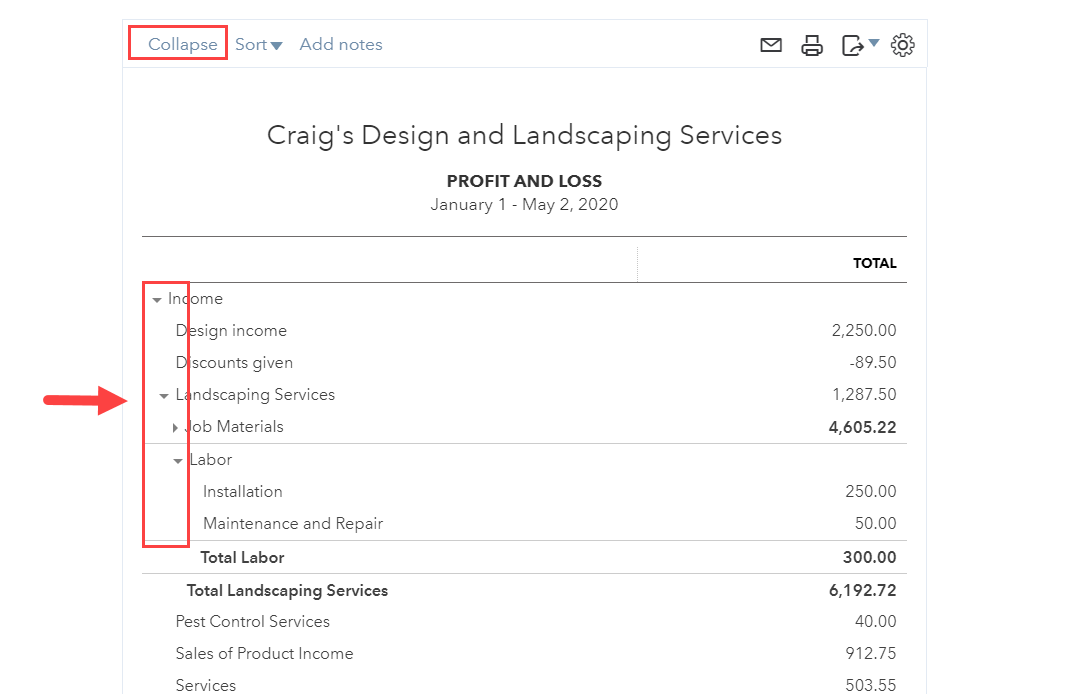
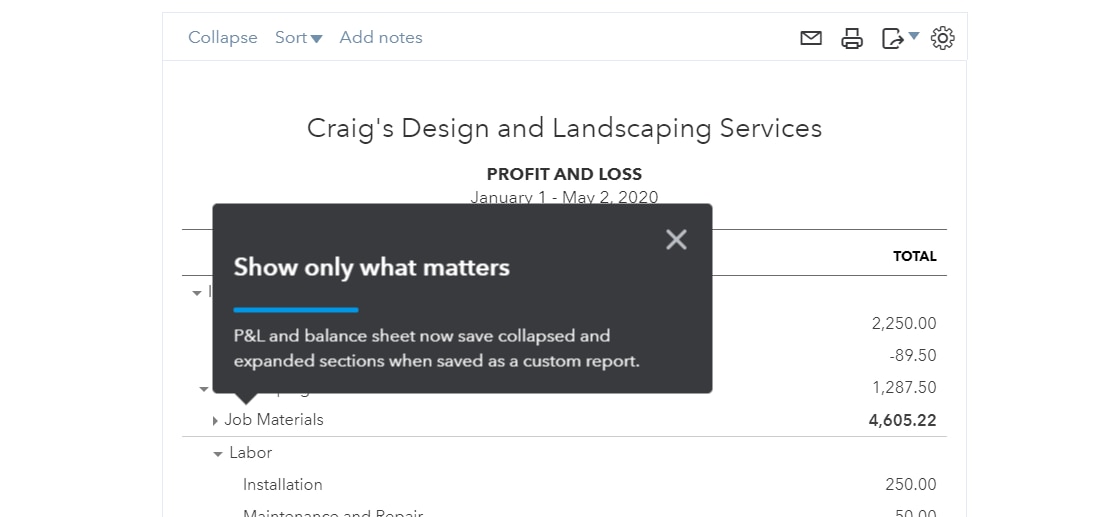
A nice feature in QuickBooks Online reports is the collapse/expand function, which allows you to choose the level of detail displayed on a report by selecting the arrows next to each level of parent/sub-account to hide or display them.

This great feature is even better because the collapse/expand settings are now saved when you select save customization to add a report to your Custom reports list.

Printing reports

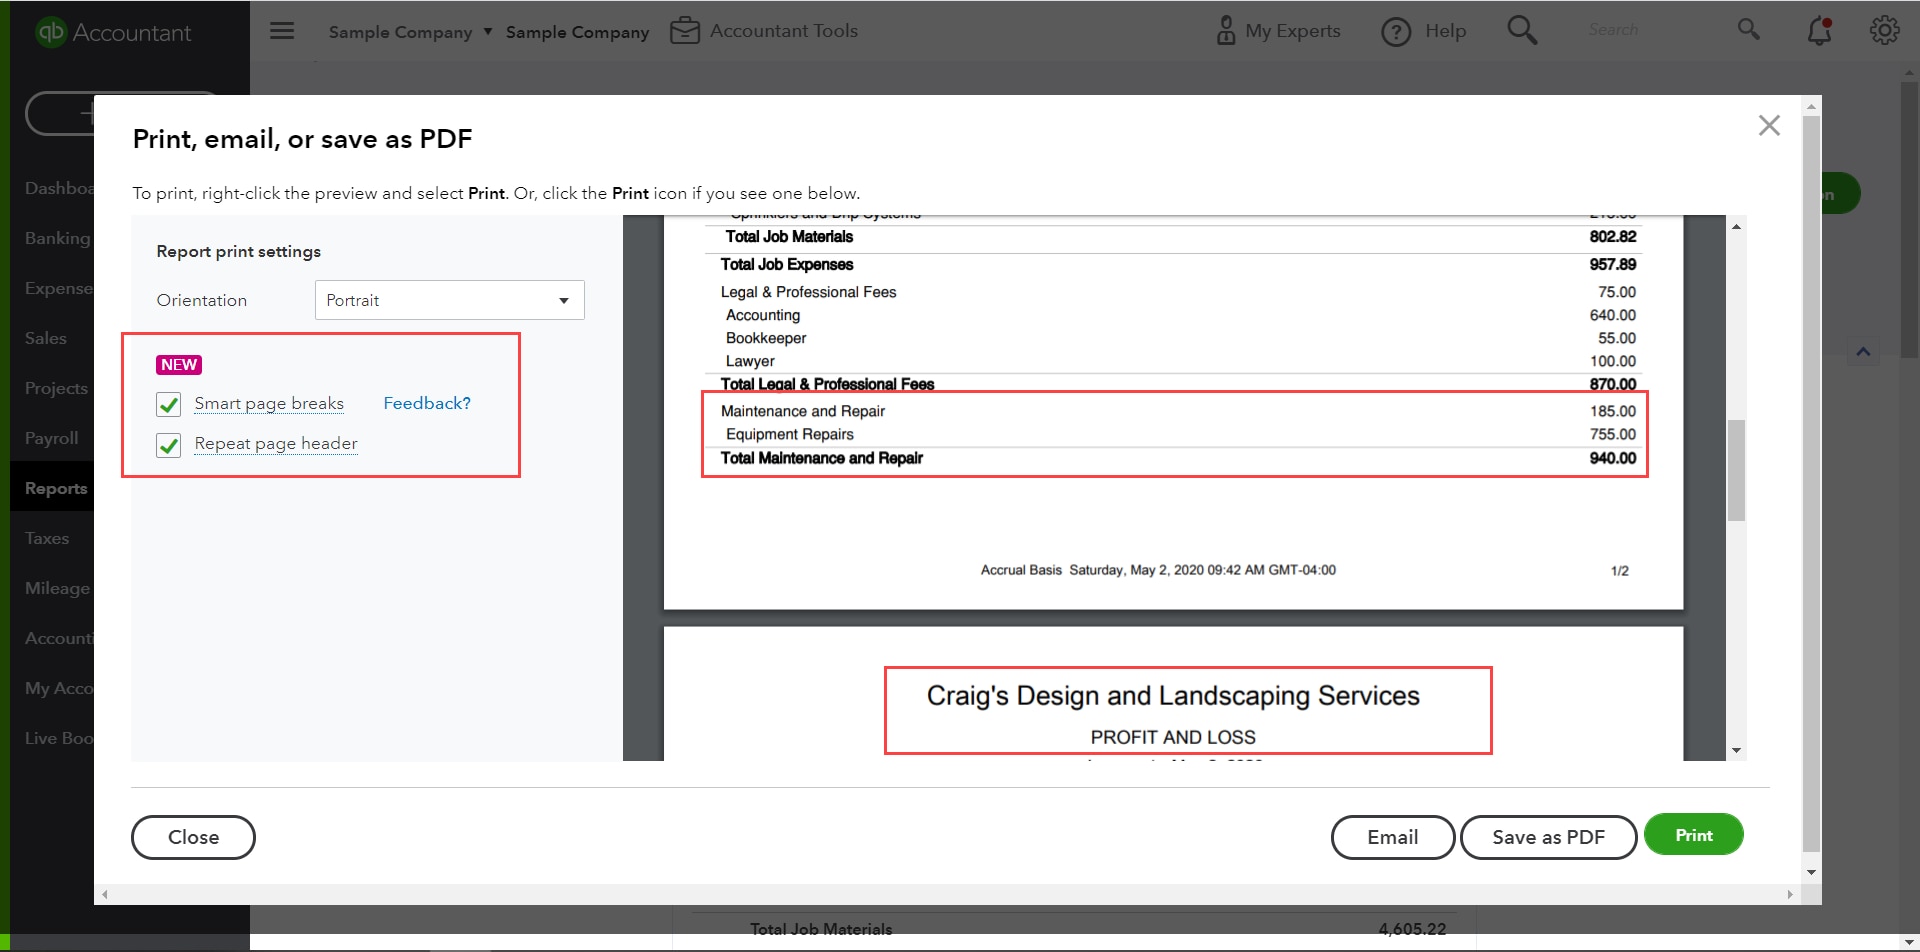
With the introduction of Smart page breaks and page headers that can repeat on each page of the report, printing reports have also improved! The Smart page breaks feature places a break appropriately after subtotals or groups of accounts. This drastically improves the appearance and readability of reports.

When designing these changes for the report center, the goal was to streamline the reporting process for accountants, as well as eliminate the need to export reports to Excel to make changes. Intuit has certainly come through!


Get the latest to your inbox

Get the latest product updates and certification news to help you grow your practice.

By clicking “Submit,” you agree to permit Intuit to contact you regarding QuickBooks and have read and acknowledge our Privacy Statement.

Thanks for subscribing.

Relevant resources to help start, run, and grow your business.

Looking for something else?

Get QuickBooks

Smart features made for your business. We've got you covered.

Tax Pro Center

Expert advice and resources for today’s accounting professionals.

QuickBooks Support

Get help with QuickBooks. Find articles, video tutorials, and more.

How can we help?
Talk to sales 1-800-497-1712

Monday - Friday, 5 AM to 6 PM PT

Get product support